
2019 Ardonia arrocane season: Difference between revisions
No edit summary |
No edit summary |
||
| Line 1: | Line 1: | ||
{{Infobox Arrocane Season|last system dissipated=Season not started|first system formed=Season not started|total fatalities=None|total damage=None|five seasons='''2019''', ''2020''|articles=None}} | {{Infobox Arrocane Season|last system dissipated=Season not started|first system formed=Season not started|total fatalities=None|total damage=None|five seasons='''2019''', ''2020''|articles=None}} | ||
==Seasonal forecasts== | ==Seasonal forecasts== | ||
{| class="toccolours" style="float:right; margin-left:1em; text-align:right; clear: right;" cellspacing="0" cellpadding="3" | {| class="toccolours" style="float:right; margin-left:1em; text-align:right; clear: right;" cellspacing="0" cellpadding="3" | ||
|+ style="color: black; text-align: center;" | '''Predictions for | |+ style="color: black; text-align: center;" | '''Predictions for 2025 Alisea hurricane season''' | ||
|- style="background:#ccf | |- style="background:#ccf | ||
| align="center" |'''Source''' | | align="center" |'''Source''' | ||
| Line 20: | Line 10: | ||
| align="center" |'''<span style="font-size:80%;">Hurricanes</span>''' | | align="center" |'''<span style="font-size:80%;">Hurricanes</span>''' | ||
| align="center" |'''<span style="font-size:80%;">Major<br />hurricanes</span>''' | | align="center" |'''<span style="font-size:80%;">Major<br />hurricanes</span>''' | ||
|- | |- | ||
|align="center" colspan="2"|''Average <span style="font-size: 80%;">(1991–2020)</span>'' || 14.4 || 7.2 || 3.2 | |align="center" colspan="2"|''Average <span style="font-size: 80%;">(1991–2020)</span>'' || 14.4 || 7.2 || 3.2 || | ||
|- | |- | ||
|align="center" colspan="2"|''Record high activity'' | |align="center" colspan="2"|''Record high activity'' | ||
|30 | |30 | ||
| | |14 | ||
| | |7 | ||
|- | |- | ||
|align="center" colspan="2"|''Record low activity'' | |align="center" colspan="2"|''Record low activity'' | ||
| | |2 | ||
|1† | |||
|0† | |0† | ||
|- | |- | ||
| colspan="7" style="text-align:center;"| <hr/> | | colspan="7" style="text-align:center;"| <hr/> | ||
| | | | ||
|- | |- | ||
| align="left" | | | align="left" |NAHC | ||
| align="left" | | | align="left" |Apr 5, 2025 | ||
| | |13-16 | ||
|7 | |4-6 | ||
| | |2-3 | ||
| | |- | ||
| | | align="left" |NAHC | ||
| align="left" |Apr 28, 2025 | |||
|14-19 | |||
|4-6 | |||
|1-3 | |||
|- | |||
| align="left" |NAHC | |||
| align="left" |May 9, 2025 | |||
|14-19 | |||
|7-8 | |||
|1-2 | |||
|- | |||
| align="left" |SK | |||
| align="left" |May 9, 2025 | |||
|17 | |||
|9 | |||
|4 | |||
|- | |||
| align="left" |MV | |||
| align="left" |May 10, 2025 | |||
|16 | |||
|10 | |||
|4 | |||
|- | |||
| align="left" |LL | |||
| align="left" |May 10, 2025 | |||
|14-17 | |||
|5-7 | |||
|2-4 | |||
|- | |- | ||
| '''Actual activity'''<br /> | | '''Actual activity'''<br /> | ||
| | | | ||
| | |2 | ||
|0 | |0 | ||
|0 | |0 | ||
|- | |- | ||
|} | |} | ||
==Seasonal timeline== | ==Seasonal timeline== | ||
| Line 105: | Line 105: | ||
PlotData= | PlotData= | ||
barset:Hurricane width:11 align:left fontsize:S shift:(4,-4) anchor:till | barset:Hurricane width:11 align:left fontsize:S shift:(4,-4) anchor:till | ||
bar:Month width:5 align:center fontsize:S shift:(0,-20) anchor:middle color:canvas | bar:Month width:5 align:center fontsize:S shift:(0,-20) anchor:middle color:canvas | ||
| Line 140: | Line 119: | ||
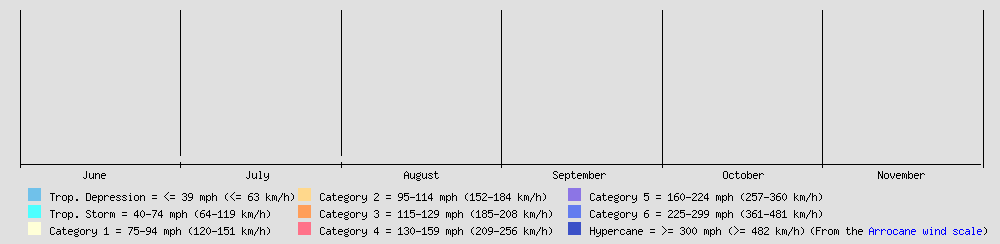
text:"(From the" | text:"(From the" | ||
pos:(870,23) | pos:(870,23) | ||
text:"[[ | text:"[[Ardonia arrocane wind scale|Arrocane wind scale]])" | ||
</timeline>}} | </timeline>}} | ||
Revision as of 16:33, 16 ⧼may_long⧽ 2025
| 2019 Ardonia arrocane season | |
| No image provided | |
| Seasonal boundaries | |
|---|---|
| First system formed | Season not started |
| Last system dissipated | Season not started |
| Seasonal statistics | |
| Total fatalities | None |
| Total damage | None |
| Related articles | |
None
| |
|
| |
| Ardonia arrocane seasons 2019, 2020 | |
Seasonal forecasts
| Source | Date | Named storm |
Hurricanes | Major hurricanes | |||
| Average (1991–2020) | 14.4 | 7.2 | 3.2 | ||||
| Record high activity | 30 | 14 | 7 | ||||
| Record low activity | 2 | 1† | 0† | ||||
| NAHC | Apr 5, 2025 | 13-16 | 4-6 | 2-3 | |||
| NAHC | Apr 28, 2025 | 14-19 | 4-6 | 1-3 | |||
| NAHC | May 9, 2025 | 14-19 | 7-8 | 1-2 | |||
| SK | May 9, 2025 | 17 | 9 | 4 | |||
| MV | May 10, 2025 | 16 | 10 | 4 | |||
| LL | May 10, 2025 | 14-17 | 5-7 | 2-4 | |||
| Actual activity |
2 | 0 | 0 | ||||
Seasonal timeline
Systems
Hurricane Pixel
| Category 5 hurricane (SLHWS) | |
|---|---|
| Duration | October 5 – October 23 |
| Peak intensity | 220 mph (350 km/h) (1-min); 868 mbar (hPa) |
Hurricane Pixel emerged as the sixteenth named storm, sixth major hurricane, and second Category 5 hurricane of the 2050 Atlantic hurricane season, originating as Invest 95L on October 6, 2050, in the southwestern Caribbean Sea with initial winds of 5 mph and a pressure of 1019 mb. The system intensified into Tropical Storm Pixel by October 7 at 12:00 UTC (40 mph, 998 mb) and underwent rapid strengthening in the warm waters of the Gulf of Mexico, reaching Category 1 by October 8 at 18:00 UTC (80 mph, 986 mb), Category 3 by October 9 at 12:00 UTC (125 mph, 956 mb), and Category 5 by October 9 at 18:00 UTC (175 mph, 908 mb). It achieved its peak intensity, the most intense hurricane on record with a minimum central pressure of 868 mb and the strongest hurricane on record with sustained winds of 220 mph (354 km/h) on October 10, 2050, at 00:00 UTC, north of the Yucatán Peninsula. Following its peak, Pixel underwent an eyewall replacement cycle (ERC), briefly weakening to 155 mph by October 10 at 12:00 UTC (915 mb), before restrengthening to Category 5 status, reaching 205 mph (879 mb) by October 11 at 18:00 UTC. Pixel then made a catastrophic landfall along the Gulf Coast of Florida near the Florida Panhandle on October 11, 2050, at 12:00 UTC, as a strong Category 5 hurricane with 200 mph winds and 884 mb pressure, bringing devastating storm surges up to 25 feet and winds that demolished coastal infrastructure. Before landfall, Pixel spawned an EF4 tornado in the Florida Panhandle, causing widespread destruction. The storm weakened to Category 4 by October 12 at 12:00 UTC (155 mph, 923 mb) over land, moved northeast, looped off the southeastern U.S. coast with winds fluctuating between 130 and 185 mph from October 14 to 15, transitioned into an extratropical cyclone on October 18 at 18:00 UTC (70 mph, 990 mb), and dissipated east of Newfoundland by October 23 at 06:00 UTC (5 mph, 1020 mb). Pixel contributed 73.84 points to the season’s Accumulated Cyclone Energy (ACE), the highest of any storm in 2050, and was the costliest hurricane ever in recorded history, with an estimated $1.5 trillion (2050 USD) in damages.
Following its landfall on the Gulf Coast of Florida, Hurricane Pixel unleashed torrential rainfall across the southeastern United States, with totals exceeding 20 inches in parts of Florida, Alabama, and Mississippi, triggering widespread freshwater flooding and necessitating numerous high-water rescues. The storm’s unprecedented power resulted in catastrophic destruction, with the $1.5 trillion (2050 USD) damage estimate reflecting extensive losses to homes, businesses, and critical infrastructure across the Florida Panhandle and adjacent Gulf Coast regions. In Florida, three deaths were reported due to flooding and structural collapse, while offshore, two individuals perished from rip currents near Alabama; the EF4 tornado before landfall added further fatalities and damage. Pixel’s expansive wind field generated additional tornadoes, including two EF0 tornadoes in Georgia, compounding the storm’s toll. Coastal areas of Louisiana, including Grand Isle, experienced moderate flooding from a 10–15 foot storm surge, while Texas saw minor wave impacts. The storm’s severity prompted mass evacuations and a federal emergency declaration, cementing its status as a historic disaster.
Storm names
The following names have been designated for the 2050 Atlantic hurricane season:
Season effects
| Sharkius–Leaf scale | ||||||||||||||||
| TD | TS | C1 | C2 | C3 | C4 | C5 | C6 | HY | ||||||||
| Storm name |
Dates active | Storm category at peak intensity |
Max 1-min wind mph (km/h) |
Min. press. (mbar) |
Areas affected | Damage (USD) |
Deaths | Ref(s).
Template:TC stats cyclone3 Template:TC stats cyclone3 Template:TC stats cyclone3 Template:TC stats cyclone3 Template:TC stats cyclone3 Template:TC stats cyclone3 Template:TC stats cyclone3 | ||
|---|---|---|---|---|---|---|---|---|---|---|
| Season aggregates | ||||||||||
| 7 systems | June 9 - Season Ongoing | 165 (266) | 928 | $201 billion | 1,056 | |||||